Amazon Pairs Network Graphs With Agentic AI to Find Root Causes in Minutes
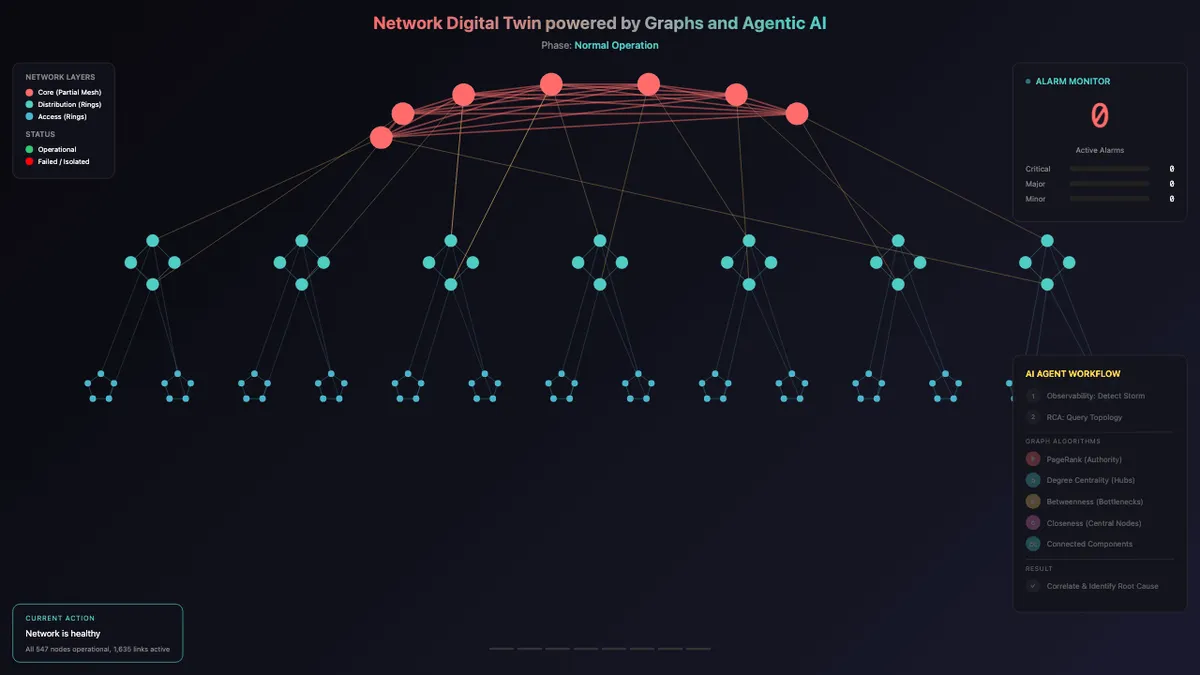
Amazon Science researchers have described an approach that combines a network "digital twin" graph, cascaded graph algorithms and agentic AI to identify the root cause of network failures. According to the authors, they demonstrated it with NTT DOCOMO at Mobile World Conference earlier this year, achieving root cause analysis in minutes on commercial networks.
- Amazon Science describes a network digital twin graph combined with agentic AI to find root causes of failures.
- A three-stage cascade of decomposition, clustering and centrality ranking narrows candidates from thousands of nodes to hundreds, then tens.
- Centrality measures are recomputed relative to the alarming nodes, with variants chosen by topology type: hierarchical, star or mesh.
- Amazon says it demonstrated the approach with NTT DOCOMO at Mobile World Conference, achieving root cause analysis in minutes on commercial networks.
- The authors say remediation in traditional network operations centers averages four to five hours for complex multilayer failures.
Why graphs fit networks
In a post by Imen Grida Ben Yahya and Nameet Dutia, Amazon Science argues that networks are natively graphs. Every device, link, open communication channel and service dependency is a vertex or an edge in a structure that can span millions of elements. The question for operational teams, the authors write, is how to let AI agents reason over that structure autonomously, adaptively and at speed.
The post traces how graph use evolved in network research. Early graphs modeled physical topology so operators could compute paths and isolate failures. Knowledge graphs and ontologies added semantics, which enabled machine-readable operations and multivendor interoperability. Alarm correlation graphs then introduced hierarchical relationships between network events, condensing tens of thousands of raw alarms into a single causal chain within minutes, though they required predefined alarm hierarchies.
Dependency graphs removed that requirement. Autogenerated in real time from software-defined-networking (SDN) and network functions virtualization (NFV) controllers, they enabled Bayesian fault localization at 95% accuracy in under 30 seconds with no manually authored rules, according to the post. Causal subgraphs and graph neural networks (GNNs) followed, the latter learning hidden intercell dependencies and spatiotemporal dynamics. Today, the authors say, these representations converge under an agentic layer that selects the right graph tool for each failure pattern.
The root cause problem and the three pillars
The authors describe root cause analysis as the natural proving ground. For complex multilayer failures, remediation in traditional network operations centers averages four to five hours and can extend to days. They attribute the bottleneck to cognitive overload rather than lack of expertise, since operators cannot correlate hundreds of alarms, configuration files and telemetry data across thousands of nodes fast enough.
Temporal correlation, where alarm A preceding alarm B implies A caused B, often fails in complex topologies. Failures can propagate through parallel paths, polling intervals can blur timing, and the true root cause may raise no alarm at all.
Amazon's design rests on three pillars: graph modeling, graph-centric analytics and agentic orchestration. The first is a continuously synchronized digital twin, a graph whose vertices are devices with attributes and whose edges are connections. It ingests dependencies, live alarms and KPIs from multiple sources across network segments and layers.
A three-stage cascade of graph algorithms
On this graph, the system runs three stages, each narrowing the search space for the next.
- Decomposition: Based on the number and strength of connections, the system finds the most-connected parts of the topology. Severed links can fragment the network into disconnected subgraphs, which lets analysis focus on boundary nodes. This narrows candidates from thousands of nodes to hundreds.
- Clustering: Community detection algorithms (Louvain or label propagation) group nodes that interact often or share dependencies. This separates failures within one cluster from those crossing cluster boundaries and narrows candidates from hundreds to tens.
- Centrality ranking: A suite of centrality algorithms ranks the remaining candidates by how likely each is to be the root cause.
The key idea in the final stage is that standard centrality scores are static and do not change when a failure occurs. For root cause analysis the authors ask which node is most important relative to a particular failure, so the alarming nodes define the reference frame and each measure is recomputed against the failure set.
Personalized PageRank seeds its random walk from alarming nodes and concentrates on their common ancestors, tracing faults upward in hierarchical topologies. The degree centrality variant counts only edges to alarming nodes: a gateway with 50 total connections but none to alarming nodes scores zero, while a switch with five alarm connections scores five. This identifies hubs of star topologies. Alarm-relative closeness measures average distance to alarming nodes only, which surfaces peripheral failures in mesh topologies.
The agentic layer classifies each affected subgraph as hierarchical, star or mesh using graph metrics such as degree distribution and diameter, then decides which variant to emphasize.
What it means for network operators
The authors present the work as a shift from graphs as a passive data model to an active substrate for agentic reasoning. The combination of precise graph algorithms and an adaptive agent is meant to cut diagnosis time from hours to minutes. The source reports the NTT DOCOMO demonstration at MWC but gives no further performance figures for it. A companion post covers the solution architecture and a runbook of common routines.
Amazon Science: Graph-centric agentic intelligence