Microsoft Research launches Flint-interactive for AI-built interactive charts
Microsoft Research has introduced Flint-interactive, a language that lets AI agents generate data visualizations users can explore by clicking, filtering, zooming and highlighting. It is built on Flint, and according to Microsoft Research it shifts the hard interaction logic to a compiler to make results more reliable and cheaper to produce.
- Flint-interactive is a language, built on Flint, for creating interactive data visualizations with AI agents.
- Flint's compiler turns clicks, drags and key presses into semantic events, and high-level update operators change the chart in response.
- It can be used in chat via Flint-MCP and MCP Apps, in apps via Flint Interactive Canvas, or with a programming API for bespoke interactions.
- Charts can be linked to tables, text and widgets to build dashboards and data stories.
- Microsoft Research says the approach targets high generation cost and unreliable interactions in agent-built charts.
The problem with AI-generated interactive charts
AI agents already make it easy to analyze data and generate reports with visualizations, according to Microsoft Research. Static charts only go so far, though. Readers often want to zoom in on details, compare data across charts, or highlight related text in a document from a chart selection, and the other way around. The researchers point to the quality of interactive stories in sophisticated data journalism as the goal.
The team says that, even with capable frontier models, two obstacles remain. The first is high generation cost: agents rarely deliver a fully satisfactory interactive visualization in one turn, and repeated rounds of reasoning, coding and debugging consume tokens and time. The second is reliability: expressive interactive charts easily end up with poor layouts or broken interactions, and fixes can introduce new problems. Built-in interactions in some visualization libraries, the post adds, are not expressive enough for bespoke charts. Microsoft Research attributes these difficulties to the lack of an expressive, high-level language for specifying visual interactions.
How Flint-interactive works
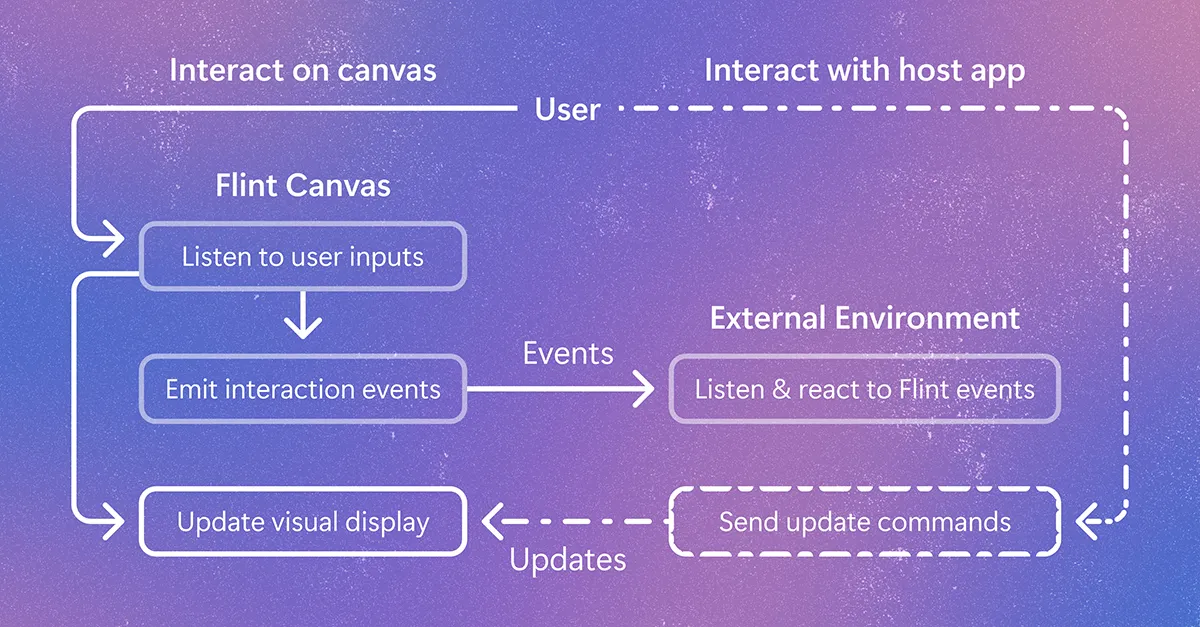
Flint-interactive relies on Flint's compiler, which translates user interactions into semantic events that capture the meaning behind what users select. High-level operators then update the visualization in response to those events. This moves the burden of resolving dependencies between interaction logic and visual logic from the user or agent to the compiler.
Microsoft Research describes a split between two layers:
- Visual logic: the compiler resolves raw triggers such as clicks, drags and key presses into semantic events that identify chart elements and data. It also turns update operators into rendered canvas changes, including hit testing and low-level visual updates.
- Interaction logic: the user or agent maps semantic events to chart update operators, such as set style to highlight data, set annotation to label a point, or set viewport to pan or zoom. The same events can update external tables, widgets or application state.
Flint Canvas, according to the post, is a state machine that tracks interactions and manages rendering state. Because event generation and visual updates are compositional, the model can also connect charts with tables, text, other charts and widgets in interactive stories and dashboards.
Three ways to use it
The first route is chat. Users can run Flint Interactive in a chat or canvas environment through Flint-MCP and MCP Apps, following the MCP setup guide. With the latest release, an agent can generate an interaction_spec alongside the Flint chart spec and render the interactive chart in the conversation. Users can also select elements and pass that context to follow-up turns.
The second route is building apps. Developers can use Flint Interactive Canvas in dashboards, data stories or other applications. Apps can use event handlers to process semantic events from Flint Canvas, for example to filter a table or update another chart, and can send update operators to the canvas so that their own widgets control how the chart changes.
The third route is bespoke interaction. Beyond the presets, developers define a trigger and a custom handler function through the programming API, mapping semantic events to custom update sequences. One example highlights a clicked country and labels it by name by combining set-style and set-annotation, without touching renderer-specific marks. In a DimpVis example, the user drags a point along a time path to see how temperature and precipitation change across cities.
What it means for users and developers
For chart users, Microsoft Research says the approach lets them interact with charts directly in chat and ask follow-up questions based on what they select. For developers building agents, the aim is to let those agents give customers interactive visualizations for exploring their data, with less development effort and fewer layout, rendering and debugging problems, according to the company.
Microsoft Research also invites contributions. Interaction designers can explore the bespoke examples, design a new interaction and turn it into a reusable preset, then propose it on GitHub to expand Flint's interaction vocabulary. App builders can share the interaction-author skill with their coding agent to add presets to an app. The post lists Chenglong Wang, Yuwei Xiao, Alper Sarikaya, Michel Galley, Chris Quirk and Jianfeng Gao as authors.
Microsoft Research: Flint-interactive: A language for creating interactive data visualizations