Comet's Opik Adds Generative Dashboards Built Through Its Ollie Assistant
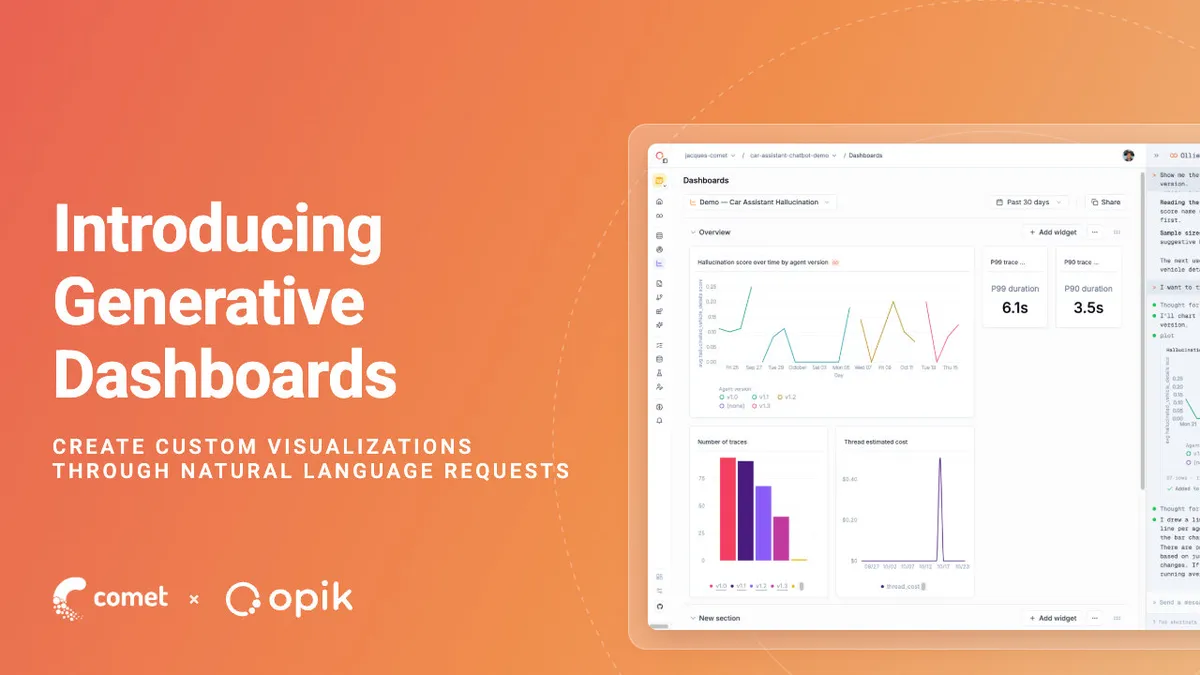
Comet has launched generative dashboards in Opik, its platform for monitoring and improving AI agents. Users describe the metric they want in plain language, and the assistant Ollie builds a custom widget for them.
- Comet's Opik platform now offers generative dashboards, built through its assistant Ollie.
- Users describe a metric in plain language, and Ollie writes a read-only SQL query against their ClickHouse instance and proposes multiple Vega-Lite chart options.
- Widgets can be added to new or existing dashboards, moved, resized, shared and edited later with Ollie.
- Comet's example tracks hallucination scores by agent version for a car-buying chatbot.
- The feature is generally available now, and a free Opik account is available to try it.
From a plain-language request to a chart
According to Comet, teams in finance, tech, e-commerce and other fields use Opik to track metrics for their agents, and those metrics differ widely. A financial services team checking that an internal support agent follows company policy needs different numbers than an automotive company verifying that a customer-facing chatbot quotes car specs correctly.
Custom dashboards can surface the right metrics, but Comet says building them takes real effort: users must understand their data schema, understand the underlying queries and decide how to visualize the results. The new feature is meant to remove that work. Instead of sifting through trace metadata, writing queries or designing charts, a user asks Ollie for what they want to see. If the result needs changes, they can keep chatting with Ollie to refine it.
Generative dashboards work exclusively through Ollie, which Comet describes as Opik's conversational AI assistant. Ollie presents a few dashboard widget views in its own interface, and users can add any of them to a new or existing dashboard with the "Add to Dashboard" button.
What happens behind the scenes
Comet outlines a multistep process. First, Ollie translates the written request into a read-only SQL query. That query pulls the relevant trace, span, thread, experiment and feedback score data from the user's ClickHouse instance. Next, Ollie analyzes the result and generates multiple distinct Vega-Lite chart specs suited to the use case, so the user can choose between them.
Once added, the chart becomes a regular widget that can be moved, resized and shared. To change it later, users click the "Edit with Ollie" button and continue the earlier conversation.
An example: tracking hallucinations in a car-buying assistant
Comet illustrates the feature with an automotive company that runs an online car-buying platform. Customers chat with an AI assistant about available inventory and vehicle specs, from horsepower and fuel economy to trim-level features. Comet notes that wrong information could cost sales and damage the company's reputation.
In the scenario, the developer team scores every conversation with a custom LLM-as-a-Judge metric that flags hallucinated vehicle details. Because they ship new agent versions regularly, they want to know whether each release improves accuracy or quietly worsens it.
The team opens Ollie from a new dashboard and asks for the average hallucination score for the car specs judge, broken down by agent version, over the last 30 days. Ollie generates a read-only SQL query, groups the results by the agent version stored in the trace metadata and returns a chart comparing scores across releases. The first chart shows that newer versions hallucinate less. The team then asks for a line chart per version to see trends over time, and Ollie updates the widget in place.
After adding the widget to their dashboard, where it updates as new traces arrive, the team can see which release is underperforming and when its accuracy began to slip. Comet says that timing helps trace the problem to a cause, such as a prompt change, an inventory update or a shift in customer questions. The team can then inspect traces from that window and fix or roll back a release before more customers receive incorrect details.
Availability and what it means for teams
Generative dashboards are generally available now in Opik, according to Comet. Users can sign up for a free Opik account or log in to an existing workspace, open a dashboard and ask Ollie for what they want to see. Documentation is available, and Comet invites users to share their work in its public Slack channel.
For teams running agents in production, the pitch is speed: Comet says users can go from question to custom visualization in a single conversation in a few minutes, rather than spending time on query writing and chart design.
Comet: Introducing Opik’s Generative Dashboard Builder