SingleStore Observability Agent Traces Cluster Problems in Minutes
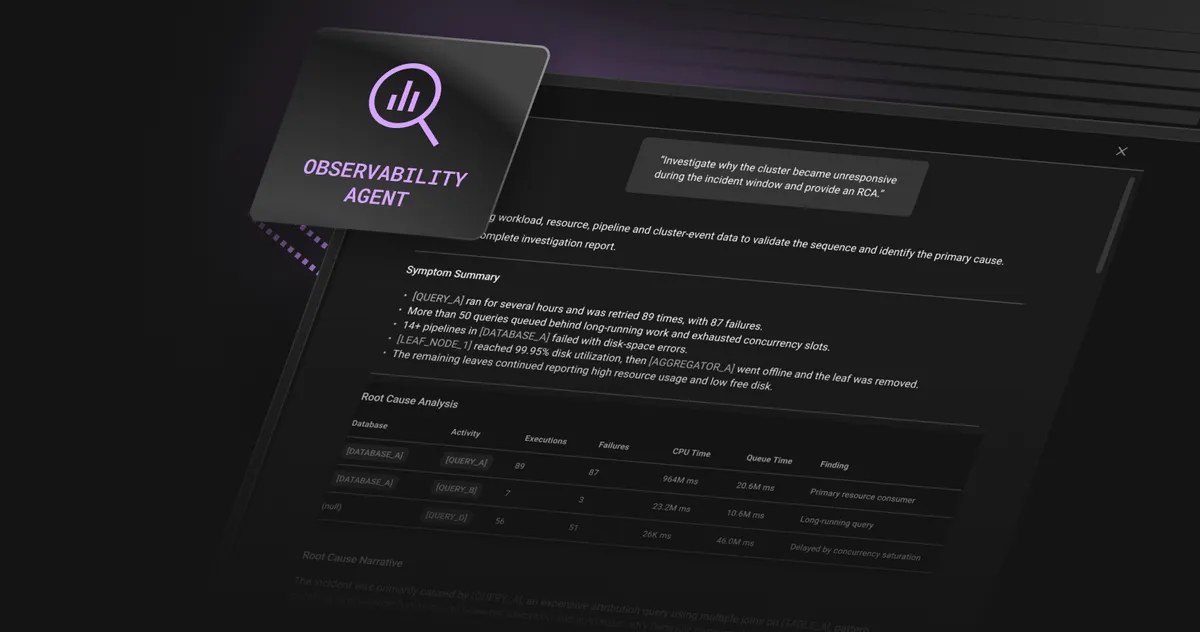
SingleStore has introduced Observability Agent, a tool that lets users ask about the health of their SingleStore workspace in plain language and get answers grounded in their own monitoring data. According to the company, it took around 2 minutes to trace a real customer memory incident that would normally cost one to three hours of manual work.
- SingleStore's Observability Agent answers plain-language questions about workspace health using the user's own monitoring data.
- The agent only diagnoses and recommends; it cannot change data, configuration, infrastructure or workloads.
- Requests run under Helios role-based access control, limiting the agent to what the user can access.
- In a real memory incident, SingleStore says the agent reached a ranked list of findings in around 2 minutes, versus an estimated one to three hours by hand.
- The agent traced the problem to two variants of one report query that failed 80 to 84% of the time and kept retrying.
What the agent does and where it stops
Observability Agent handles questions that someone would otherwise have to answer by hand. SingleStore gives examples: how CPU, memory and disk behaved on a cluster over the last hour and whether any node is an outlier, which queries used the most resources in the last thirty minutes, and why a pipeline slowed down between two points in time. Users can also ask whether a resize, a node event or a memory event lined up with failures, or compare read and write throughput before and after a given time.
The agent reads the data, follows the evidence from one signal to the next and stops when the cause is clear. SingleStore says it shows its work, so the answer can be checked rather than taken on trust. Users can also start from a chart that looks wrong and hand it to the agent, which picks up the cluster and time window from what they were viewing.
The agent only diagnoses. According to SingleStore, it will not change data, alter configuration, resize infrastructure or stop a workload. It explains what is happening and recommends what to do, and the decision stays with the user. Every request also runs under the same Helios role-based access control the user already has, so the agent can only investigate workspaces the user can reach and read data the user is entitled to read.
A memory incident on a production cluster
SingleStore describes a case in which a production workspace began returning memory errors mid-morning. The error said that memory used by MemSQL had reached the 'maximum_memory' setting on the node, with in-use table memory of 7676.00 Mb and in-use query execution memory of 83537.69 Mb. The customer's team had done the obvious checks and reported a critical production incident.
The first answer was that memory was accumulating in query execution rather than table memory, so the workload should be reduced or the workspace scaled up. SingleStore calls that correct but not very helpful, since the team could not see which workload was filling the Query category.
Finding that by hand, the company says, means combining four sources: the Cluster Detailed View, Historical Workload Monitoring, cluster trace logs through Loki or a cluster report, and an allocator breakdown via SHOW STATUS EXTENDED. The final step is comparing the same time window from previous days with today. SingleStore estimates one to three hours for someone who already knows the route.
How the agent found the cause
Given the error and the reported time window, the agent first ruled out table memory, which stayed flat at roughly the 7.7 GB the error reports. Query execution memory rose from about 2.4 GB to over 70 GB within a single five-minute interval, a step change rather than gradual growth.
The agent then ranked workloads by memory rather than by duration. This explains why the team's own check found nothing: they had looked for a long-running query, but the limit was reached by several attempts running at once. Two variants of the same report query, SelectReport_A_v1 and SelectReport_A_v2, together accounted for 97.5% of the memory attributed across the six workloads listed. Both failed 80 to 84% of the time.
The agent concluded that a workload dominating memory and failing four times out of five was being retried, with each attempt taking its share of memory again. The failures were sustained by the queries themselves. Memory-limit errors fired on every leaf node and continued for about an hour.
The second answer therefore named something to change: find the Looker report generating the SelectReport_A variants and throttle it. Scaling up remained an option, but SingleStore notes it might simply have given the retry loop more room. The agent also flagged that SelectReport_C had spilled more than 40 GB to disk while hitting memory limits, a second source of pressure. The customer said it would investigate the highlighted queries, and the ticket was closed.
Why SingleStore built it on its own database
SingleStore says it already holds the observability signals behind such investigations, including cluster health, workload history and pipeline activity for Helios. Each step asked a different question: one metric over time, then five hours of query history grouped by distinct query and ranked, then the same history sliced by failures.
The company argues that precomputed rollups and dashboards answer questions someone thought of in advance, while an investigation is whatever the last answer forces you to ask next. An agent can afford to chase a wrong lead only if it costs another query rather than another minute, which SingleStore says is what makes a two-minute investigation possible.
The agent also follows a set order that, according to the company, its own engineers use on memory-pressure tickets: rule out table memory, rank workloads by memory, and check failure rates on whatever ranks first.
What it means for users
For SingleStore users, the pitch is a way to hand a live production problem to a tool that cannot touch their systems and stays within their permissions. The two-minute figure comes from one customer incident described by SingleStore, so it is the company's own account rather than an independent benchmark.
SingleStore: Introducing Observability Agent: Gets you from symptom to cause in minutes