Vercel Sandbox adds memory usage data to its observability tools
Vercel Sandbox observability now includes memory usage data, available in the Vercel dashboard and through the CLI via the vercel metrics command. The addition sits alongside the existing CPU usage and data transfer metrics.
- Vercel Sandbox observability now includes memory usage data in the dashboard and the CLI.
- The Memory Usage card reports average, P75 and P95 memory across sandboxes.
- Detail page charts scale to the sandbox's memory limit and show a dashed line at 85% of it.
- Memory is available in the query builder as memoryUsedBytes, with custom queries and chart alerts.
- The CLI exposes it as vercel.sandbox.memory_used_bytes via vercel metrics, with --all for team-wide data.
Memory Usage card in the dashboard
According to Vercel, the new Memory Usage card reports average, P75 and P95 memory across your sandboxes. It appears next to the existing CPU usage and data transfer metrics on the sandbox overview page, as well as on the project-level and team-level pages. The card shows usage over time, including the P75, P95 and average values.
The sandbox detail page gets charts built to show how close a sandbox is running to its memory ceiling. Vercel says they do this in two ways:
- The y-axis scales automatically to the sandbox's memory limit.
- A dashed reference line marks 85% of that limit.
This makes it easier to see at a glance whether a sandbox is approaching the upper bound of the memory available to it.
Custom queries and alerts
Sandbox memory is also available in the Observability query builder as the memoryUsedBytes measure on the sandbox usage event. Users can build custom queries against this measure and create alerts from the chart. The source does not describe alert thresholds or notification options beyond that.
Access through the Vercel CLI
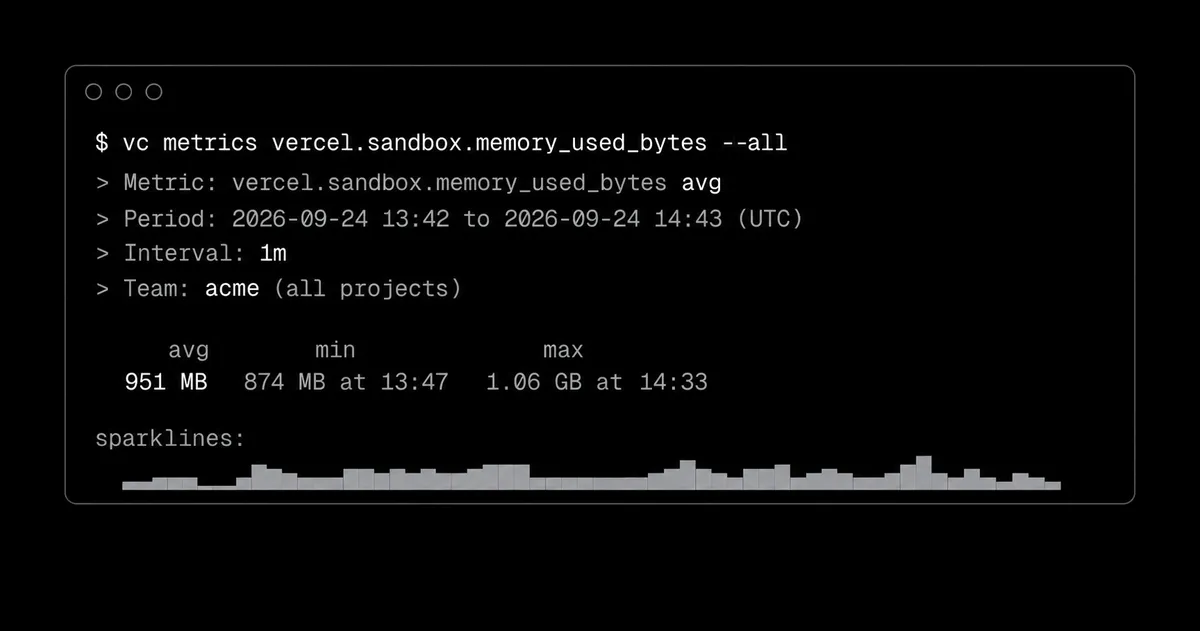
The same data can be retrieved from the Vercel CLI with the vercel metrics command, using the metric name vercel.sandbox.memory_used_bytes. Running the command in a linked project returns project-specific data. Appending --all returns aggregate data across all projects in your team.
The example in Vercel's announcement shows the command run with --all. The output lists the metric, the reporting period, a 1m interval and the team. It also gives summary figures for total, average, minimum and maximum, followed by a sparkline of the series.
According to Vercel, the CLI returns the following:
- The metric
- The reporting period
- The measurement interval
- The project the sandbox is associated with
- A graph of memory usage, with min, max and avg values
What it means for users
Until now, the Sandbox observability views covered CPU usage and data transfer. With memory data added, users can check memory consumption in the dashboard, query it in the Observability query builder, or pull it into terminal workflows through the CLI. The 85% reference line and the limit-scaled charts are aimed at spotting sandboxes that run close to their memory limit. Further details are in the Sandbox documentation, to which Vercel points readers.
Vercel: Vercel Sandbox now supports memory observability