AI Buildout to Cost $10.3 Trillion by 2032, Brookings Paper Projects
A new Brookings Papers on Economic Activity paper projects that the AI buildout will total $10.3 trillion from 2025 to 2032, an average of 3.63% of U.S. GDP per year. According to the paper, that is larger relative to the economy than past booms in railroads, highways and telecommunications.
- A Brookings paper projects AI buildout spending of $10.3 trillion from 2025 to 2032, or 3.63% of U.S. GDP per year.
- Author Stijn Van Nieuwerburgh says this is about 50% larger than the railroad boom and more than three times the internet boom.
- The paper assumes about $4.1 billion for a 100 megawatt facility in 2025, with costs rising 4% per year.
- Hosts say Meta and Microsoft are spending more on AI than their operating cash flow, using leases, joint ventures and private credit.
- Van Nieuwerburgh does not call the boom a bubble but flags what regulators and investors should watch.
A physical investment, not just software
AI is often described as a software story, but the Brookings summary stresses that the boom is also a large physical investment in data centers, power systems and specialized chips. The paper, titled "Financing the AI Build-Out," is by Stijn Van Nieuwerburgh of Columbia Business School. It was presented at the fall 2026 Brookings Papers on Economic Activity conference, hosted by Brookings in September.
Van Nieuwerburgh discussed the findings with Aaron Klein, a senior fellow in Economic Studies at Brookings, on the Brookings Podcast on Economic Activity. The conversation focuses on what the buildout means for transparency and risk.
How it compares with earlier booms
In the podcast, Van Nieuwerburgh gave his central estimate of 3.6% of GDP per year from 2025 until 2032. On the same approximate basis, he said the railroad boom averaged about 2.2% of GDP during its peak of roughly 20 years between 1870 and 1890. Other comparisons he listed:
- Highways in the 1950s: about 1.1% of GDP
- The telecom and fiber boom: about 1.1% of GDP
- Canals: about 0.66% of GDP
- Electrification: about 0.5% of GDP
He said the AI estimate is about 50% larger than the railroad boom, the largest of the earlier episodes, and more than three times the internet boom. He added two qualifications: historical estimates are not always perfectly harmonized, and the railroad figure leaves out rolling stock such as locomotives, so it may be somewhat underestimated. His point, he said, is not false precision but that the current boom has a large impact on the macroeconomy.
Cost assumptions and the efficiency question
Klein pressed on the paper's cost assumption, noting that computing tends to get cheaper over time. Van Nieuwerburgh said the paper uses about $4.1 billion for a 100 megawatt facility in 2025 and assumes that dollar cost rises by 4% per year, so it does not assume a constant nominal price. About two-thirds of the cost comes from IT equipment, and one-third from the data center building and power infrastructure.
The paper sizes data centers in megawatts rather than in floating point operations. Van Nieuwerburgh argued that better chips may deliver more computing per watt, but that cheaper compute raises demand, as frontier developers train larger models and users run more inference. He pointed to the rebound effect, sometimes called Jevons Paradox. He relayed a developer's remark that the use case line is "12 miles long."
Financing and what to watch
The hosts' introduction highlights the financing side. They say companies such as Meta and Microsoft are now spending more on AI investments than they bring in through operating cash flow, and are turning increasingly to leases, joint ventures and private credit. The hosts liken this to earlier booms, including the internet and fiber optic booms of the early 2000s.
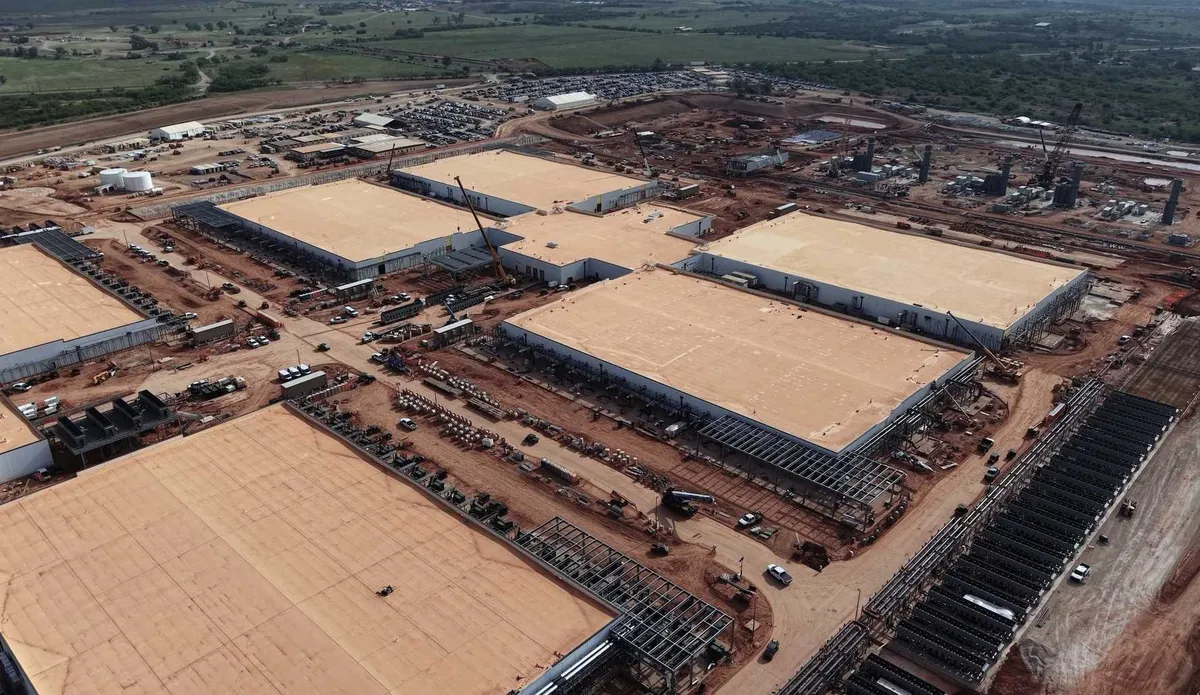
According to the hosts, Van Nieuwerburgh walks through Meta's Hyperion Data Center project as an example of how such structures work and why they can make debt-like leverage harder to see from outside. He does not label the boom a bubble, but he flags what regulators and investors should be watching.
For investors and regulators, the takeaway from the source is that the scale of the spending and the way it is financed both matter for transparency and risk.
Brookings (AI): The $10 trillion question: Financing the AI buildout