Mastra adds observability alerts for costs, errors and eval scores
Mastra Platform now lets users create observability alerts for model costs, error rates, latency, token usage and evaluation scores. Notifications can be sent to Slack, Discord, Microsoft Teams, email, webhooks, PagerDuty or incident.io.
- Mastra Platform supports alerts for costs, errors, latency, token usage and eval scores.
- Notifications can go to Slack, Discord, Microsoft Teams, email, webhooks, PagerDuty or incident.io.
- Thresholds can be checked across matching traffic or by agent, tool, model or user.
- Mastra checks enabled rules every five minutes.
- Only organization admins can create, edit and delete alerts.
Alerts cover agent behavior and spending
Mastra says the alerts are designed to identify when an agent's behavior moves outside limits set by its users, even while the underlying service continues running. This can help teams learn about rising costs or operational problems before a bill becomes too high or a user reports an issue.
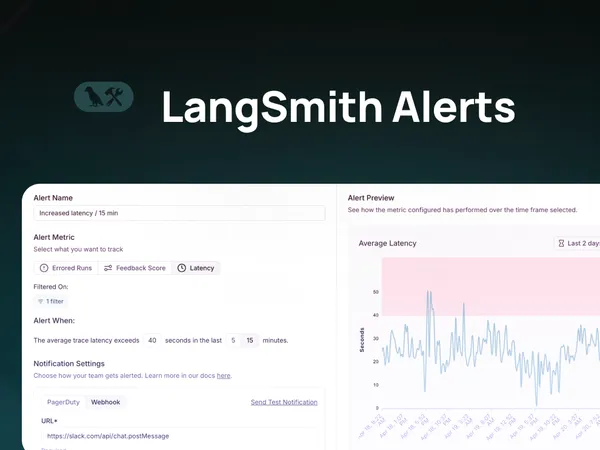
Rules can track errors and volume, including error rate, number of errors, and the total count of matching traces or spans. Latency conditions include duration, time to first token, and time to first chunk.
Mastra also supports thresholds for total, input, output, reasoning, and cached tokens. Cost and evaluation alerts can monitor spend or the average score from a scorer selected by the user.
Rules can be applied to specific traffic
Users can check a threshold across all matching traffic or separately for each agent, tool, model, or user. The platform includes templates, such as Tool failures, which is intended to monitor how often a tool fails. Users can also choose Start blank to write a query and condition from scratch.
A Backtest chart shows when a rule would have opened and closed on recent traffic. Teams can use that view to adjust a threshold before creating the alert. Alerts can also be created from the Metrics dashboard by selecting the bell icon on a chart.
Setup runs through Mastra Platform
To begin, users need to configure their app to send traces to Mastra Platform, run an agent, and confirm that its traces appear in the project. In the dashboard, they select Alerts from the sidebar, choose New alert, then select Observability alert and a template.
After choosing a project, users set a threshold and select a notification destination. Mastra checks enabled rules every five minutes. The company says only organization admins can create, edit, and delete alerts, while members and viewers have read-only access.
A built-in alternative to manual monitoring
Mastra previously offered incident alerts for events such as failed deployments or crashed services. According to the company, users who wanted to monitor agent behavior had to watch the Metrics page themselves or export traces and build alerts in tools such as Datadog or Grafana.
Observability alerts move that configuration into Mastra Platform, giving teams a single place to define thresholds and route notifications for agent quality, reliability, latency, usage and cost. The feature is aimed at users who already send traces to Mastra Platform and need automated monitoring across their agent traffic.