Neo4j Adds Tools to Turn Documents and Warehouse Data Into Knowledge Graphs
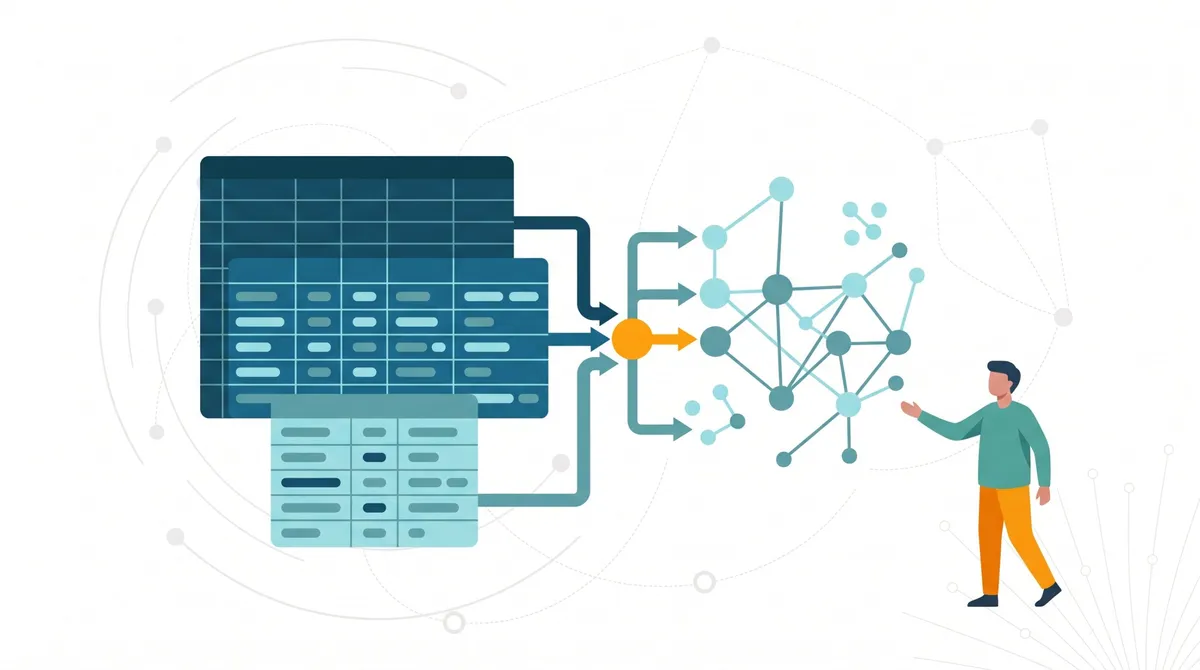
Neo4j says two products can help organizations turn existing documents and warehouse data into knowledge graphs without manually extracting every detail or migrating warehouse data. The tools are designed to give AI agents connected business context for decisions such as reviewing a loan application.
- Neo4j introduced Document Intelligence and Virtual Graph in its knowledge-layer series.
- Document Intelligence extracts graphs from plain text files, PDFs and Microsoft Word files.
- Virtual Graph models warehouse tables without copying or migrating the data.
- Neo4j’s example combines a business plan with 12 Databricks tables for loan analysis.
Building context from existing data
In a November 10, 2026 post, Neo4j described a knowledge graph as a way to map relationships between customers, accounts, loans and documents. According to the company, those relationships can help an AI agent answer complex questions and identify connections that may be missed when information remains in tables or documents.
Neo4j says organizations with terabytes of tabular data and hundreds of documents have traditionally faced copying, modeling and extraction work before they could create a usable knowledge graph. The company presents Document Intelligence and Virtual Graph as ways to reduce that effort while working with existing information.
Document Intelligence extracts a graph from files
Document Intelligence turns unstructured documents into a graph without requiring users to extract the information by hand. Neo4j says it supports plain text files, PDFs and Microsoft Word files, and does not require users to write code.
In the company’s example, a markdown business plan for Rosa Alvarez’s business identifies Rosa as owning 70% and Marcus Alvarez as owning 30%. It also includes an EIN, an address, a $400,000 loan request, a table of uses and an argument for repayment. Document Intelligence extracts people, organizations and the loan request into a graph.
Users begin by uploading a document and writing a prompt to guide extraction. Neo4j says additional prompts can refine the graph model, while a preview lets users explore the resulting graph.
Virtual Graph works over warehouse tables
Virtual Graph creates a graph model on top of existing warehouse tables, without copying the data or requiring migration. It translates Cypher queries into SQL that runs in the warehouse. According to Neo4j, the data stays in the warehouse, with the query sent in and only its results returned.
Neo4j’s example uses Nordtell Bank, whose customer information is held in 12 Databricks warehouse tables covering customers, accounts, transactions, credit scores and loan facilities. The graph model connects those records so an AI agent can examine a customer’s banking relationship before making a recommendation about Rosa’s business loan.
Teams can define the graph model manually, generate it from a database schema or create it with AI from table metadata. Neo4j says users can then refine the result with a point-and-click editor.
What this means for AI agents
The two products create separate sources of connected context in the example: Document Intelligence builds a graph from Rosa’s business plan, while Virtual Graph builds one over the bank’s Databricks tables. Neo4j says a later post will connect those sources so an agent can review the $400,000 loan request.
For users, the approach offers a way to make documents and warehouse records available as structured relationships rather than isolated rows or files that must be read from end to end. The company’s broader series also covers ontology design, composite databases and grounding decisions in precedent.